On the night between 10 and 11 May 2024, the night skies across the entire national territory were colored with auroral emissions, a particularly rare phenomenon in our latitudes. We try to briefly reconstruct in this article step by step what events occurred from the Sun to the Earth leading to this spectacular phenomenon.
It can be said that everything began with the arrival (with the normal solar rotation) in the visible hemisphere of a new group of sunspots already quite extensive since May 2-3 and identified with the NOAA number 13664 (Fig. 1). This region initially had a rather simple magnetic configuration, i.e. dipolar (classified as a beta region), therefore with a low probability of solar flares. However, starting around May 6, a new group of spots (numbered 13668) began to emerge Eastward of the pre-existing group, not only significantly increasing the longitudinal extension of the spot region, but above all increasing the complexity of the magnetic configuration (classified as beta-gamma delta, i.e. a group of spots with a magnetic field complexity preventing a clear separation between two polarities, and containing umbrae of opposite polarity in a single penumbra).
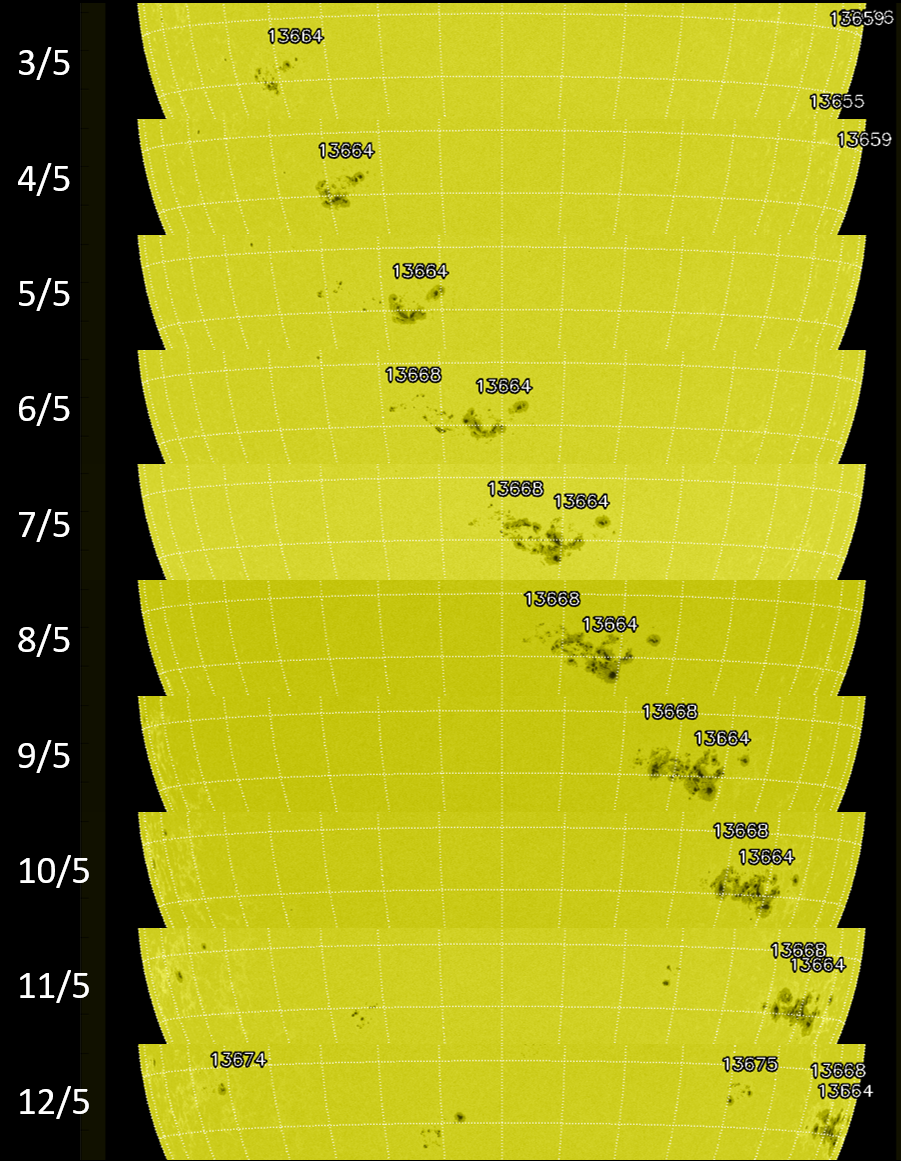
Figure 1: Evolution of the spot groups 13664 and 13668 during the days from 3 to 12 May 2024 as observed by the HMI instrument on board the NASA SDO satellite.
The increase in magnetic complexity led to a sudden increase in eruptive activity from this region which, starting from the end of May 7, began to emit multiple M-class and especially X-class flares, in accordance with the classification provided by the measurements acquired by NASA’s GOES satellite. In particular, 11 X-class flares were observed from the same region in the following days until its disappearance behind the visible edge of the sun (Table 1), and a much greater number of M-class flares.
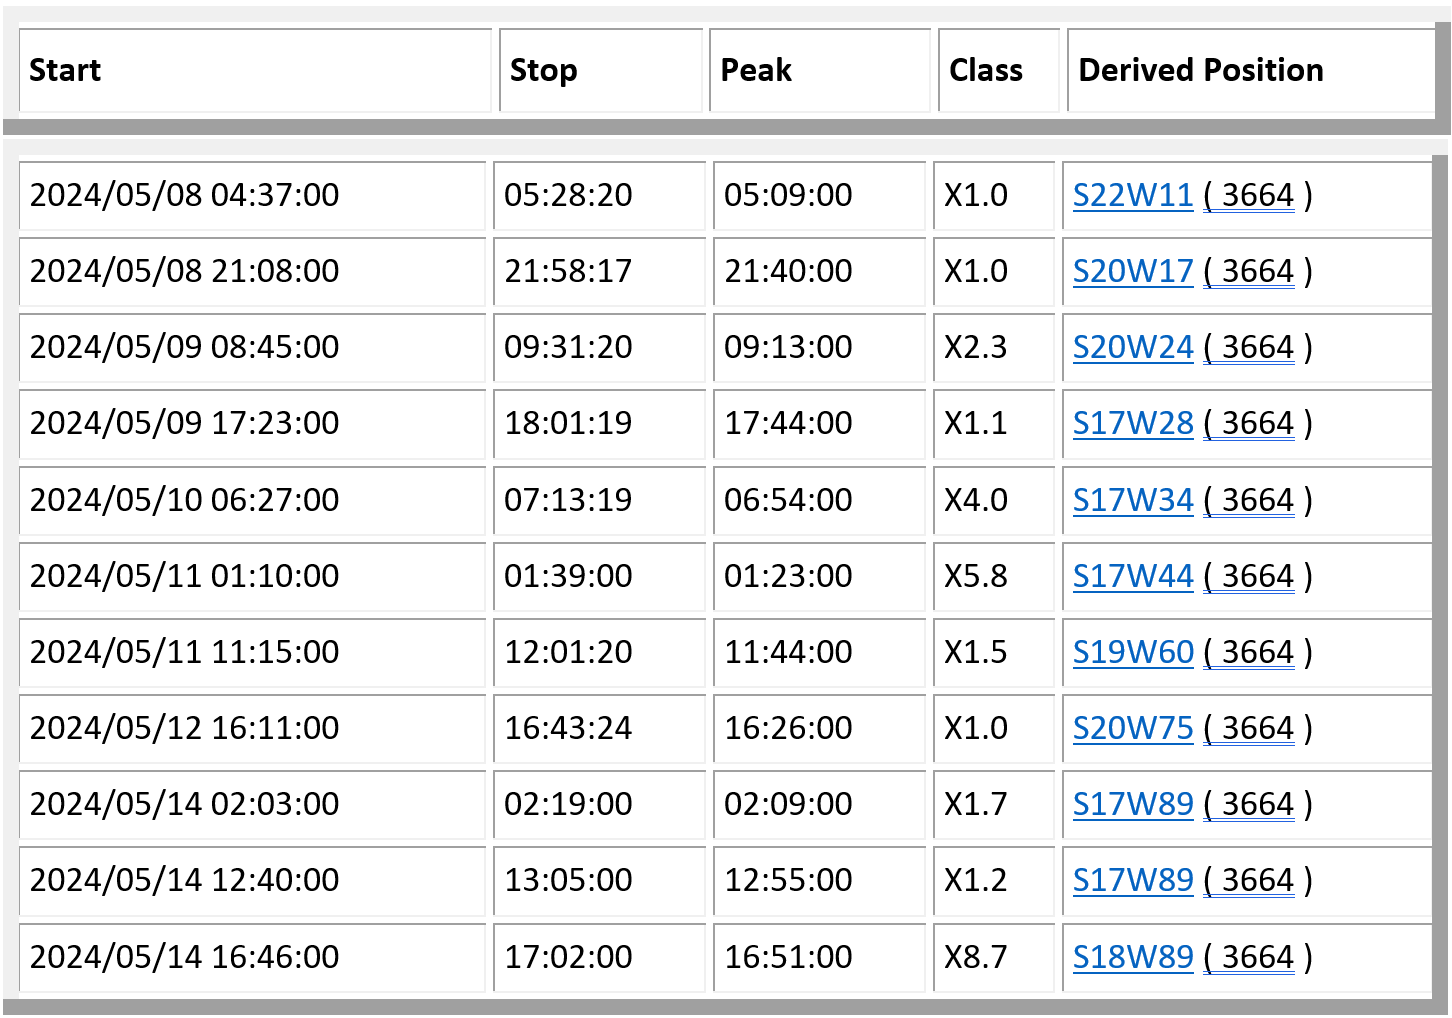
Tab. 1: sequence of X-class flares that occurred in the two regions 13668 and 13664 between 8 and 14 May 2024.
Among the various more intense flares, some also produced Coronal Mass Ejections (or CMEs) largely directed towards the Earth and therefore called “halo CMEs”, given the rather favorable position close to the center of the hemisphere visible from Earth of the source region. In particular, the three flares that occurred on May 8th, two of which were X1.0 class with peak at 05:09 and 21:40 UT, and a third one M8.6 class at 12:04 UT, produced three eruptions directed towards the Earth, and visible in Figs. 2, 3, and 4.
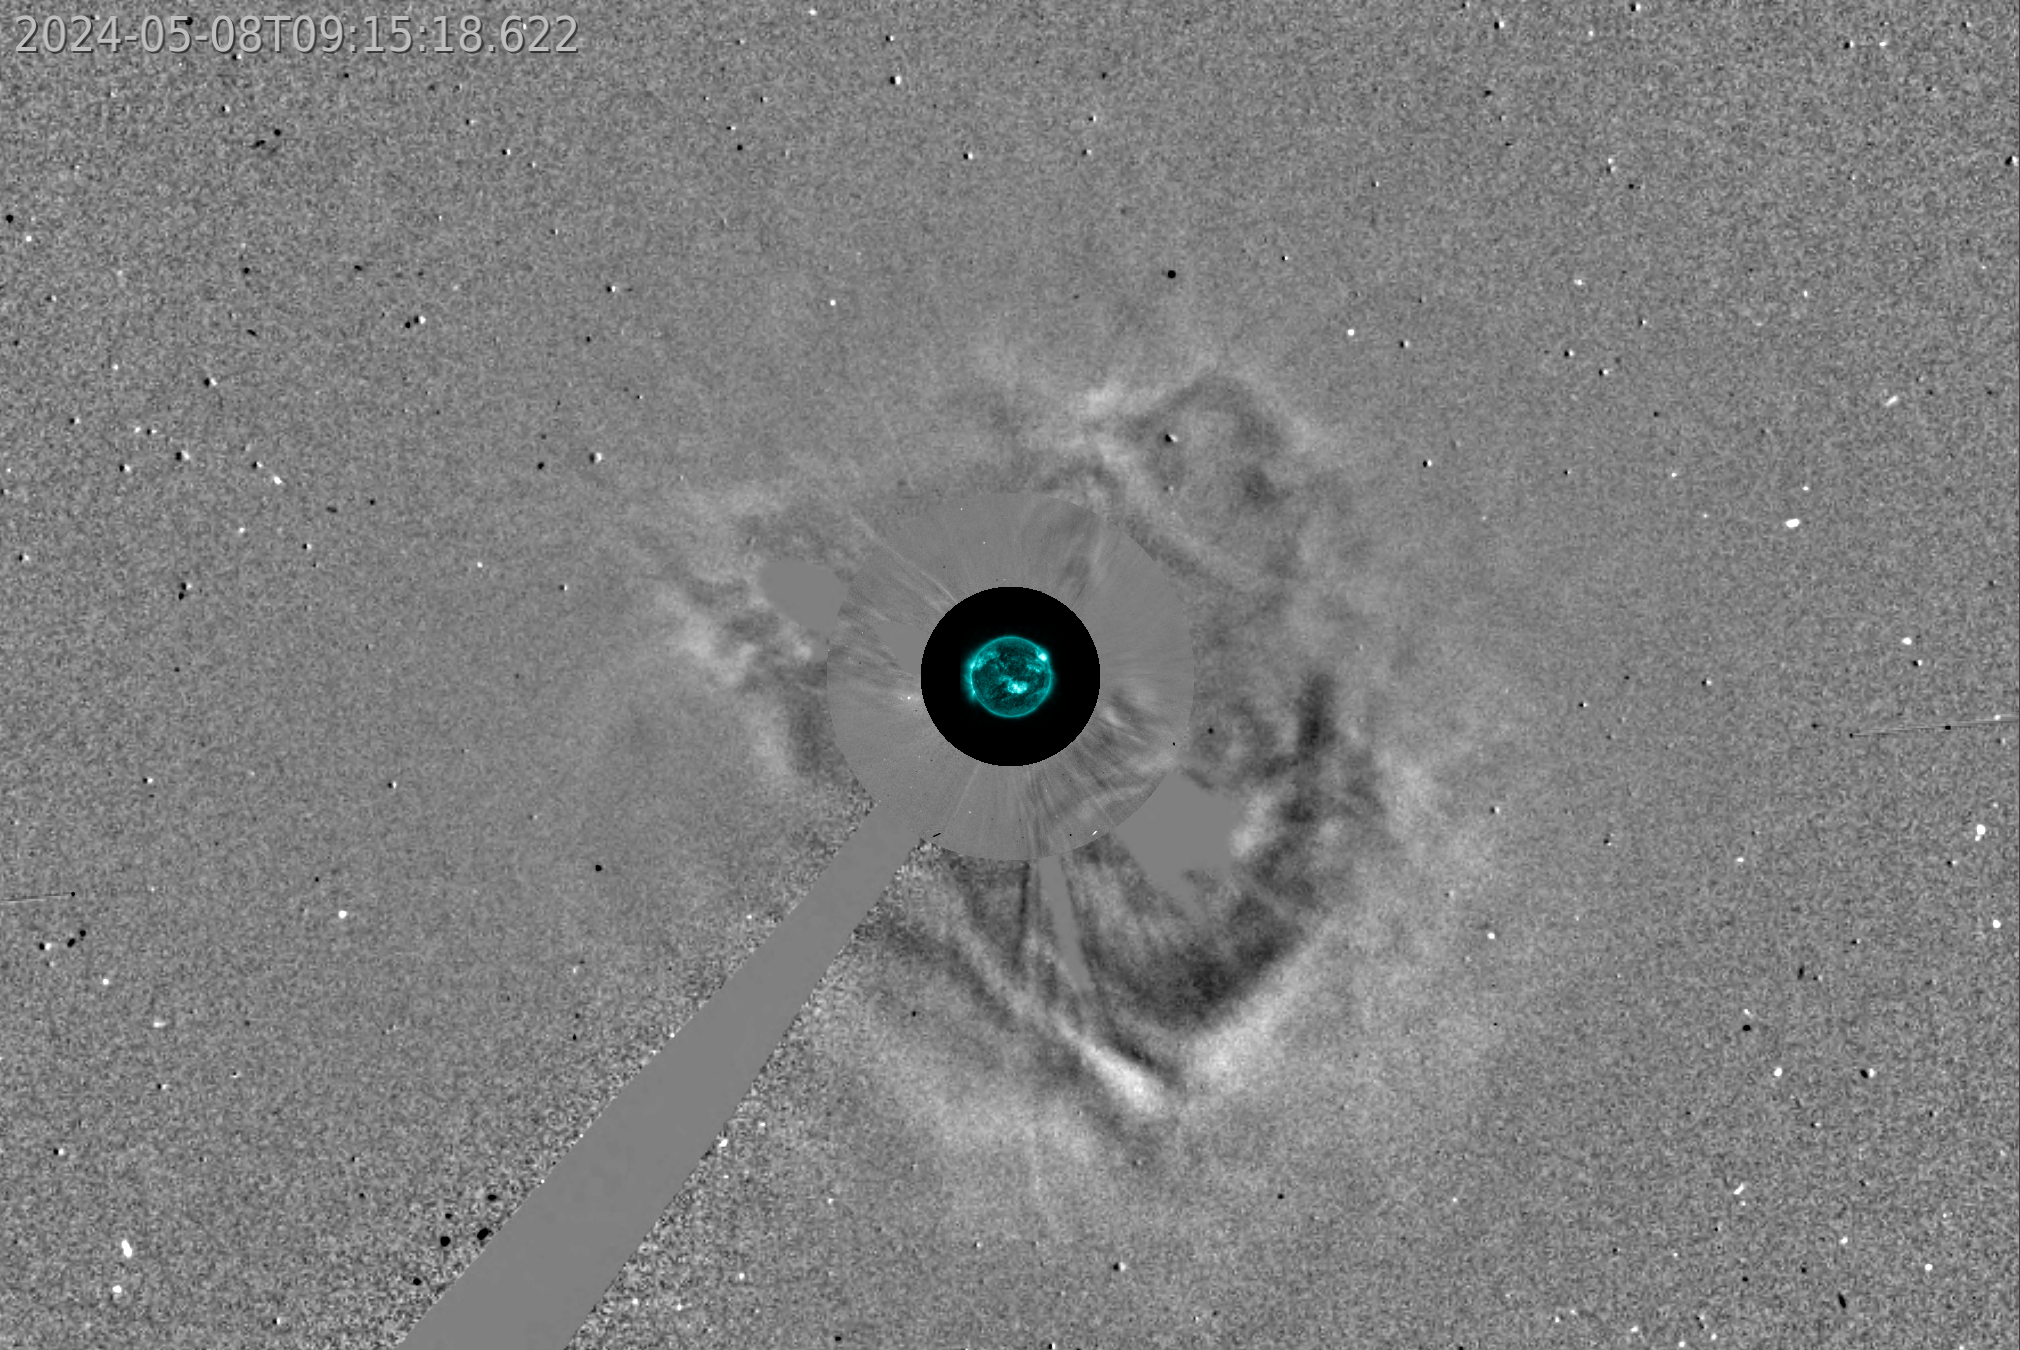
Figure 2: The first eruption directed towards the Earth and associated with the X1.0 flare of 8 May peaking at 05:09 UT. The image is a composition obtained with JHelioviewer of SOHO/LASCO C2 and C3 running difference images and SDO/AIA 171 images.
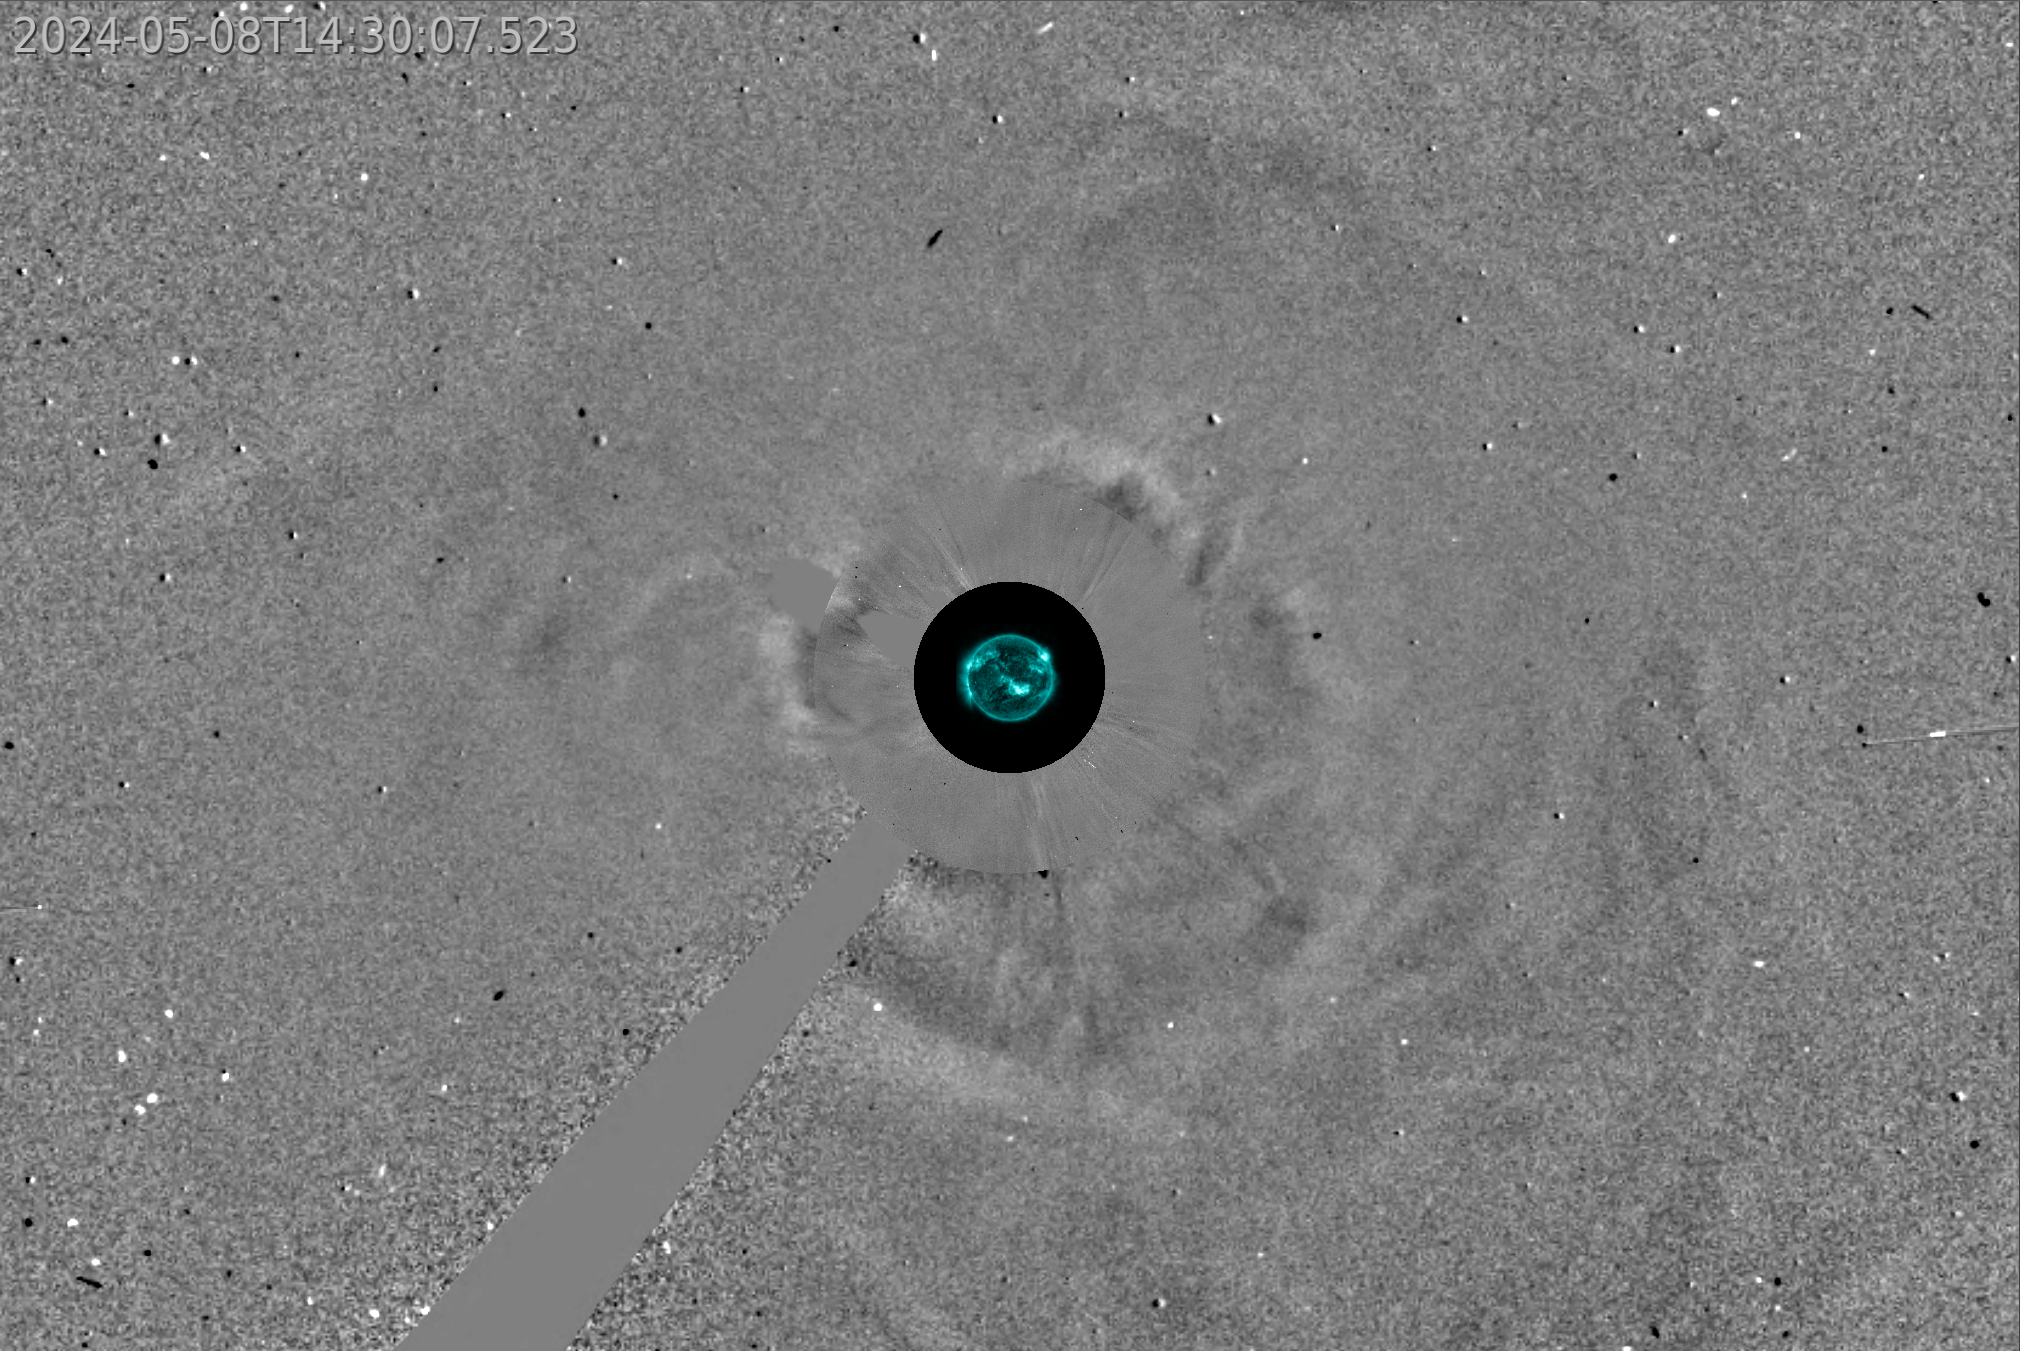
Figure 3: The second eruption directed towards the ground and associated with the M8.6 flare of 8 May peaking at 12:04 UT. The image is a composition obtained with JHelioviewer of SOHO/LASCO C2 and C3 running difference images and SDO/AIA 171 images.
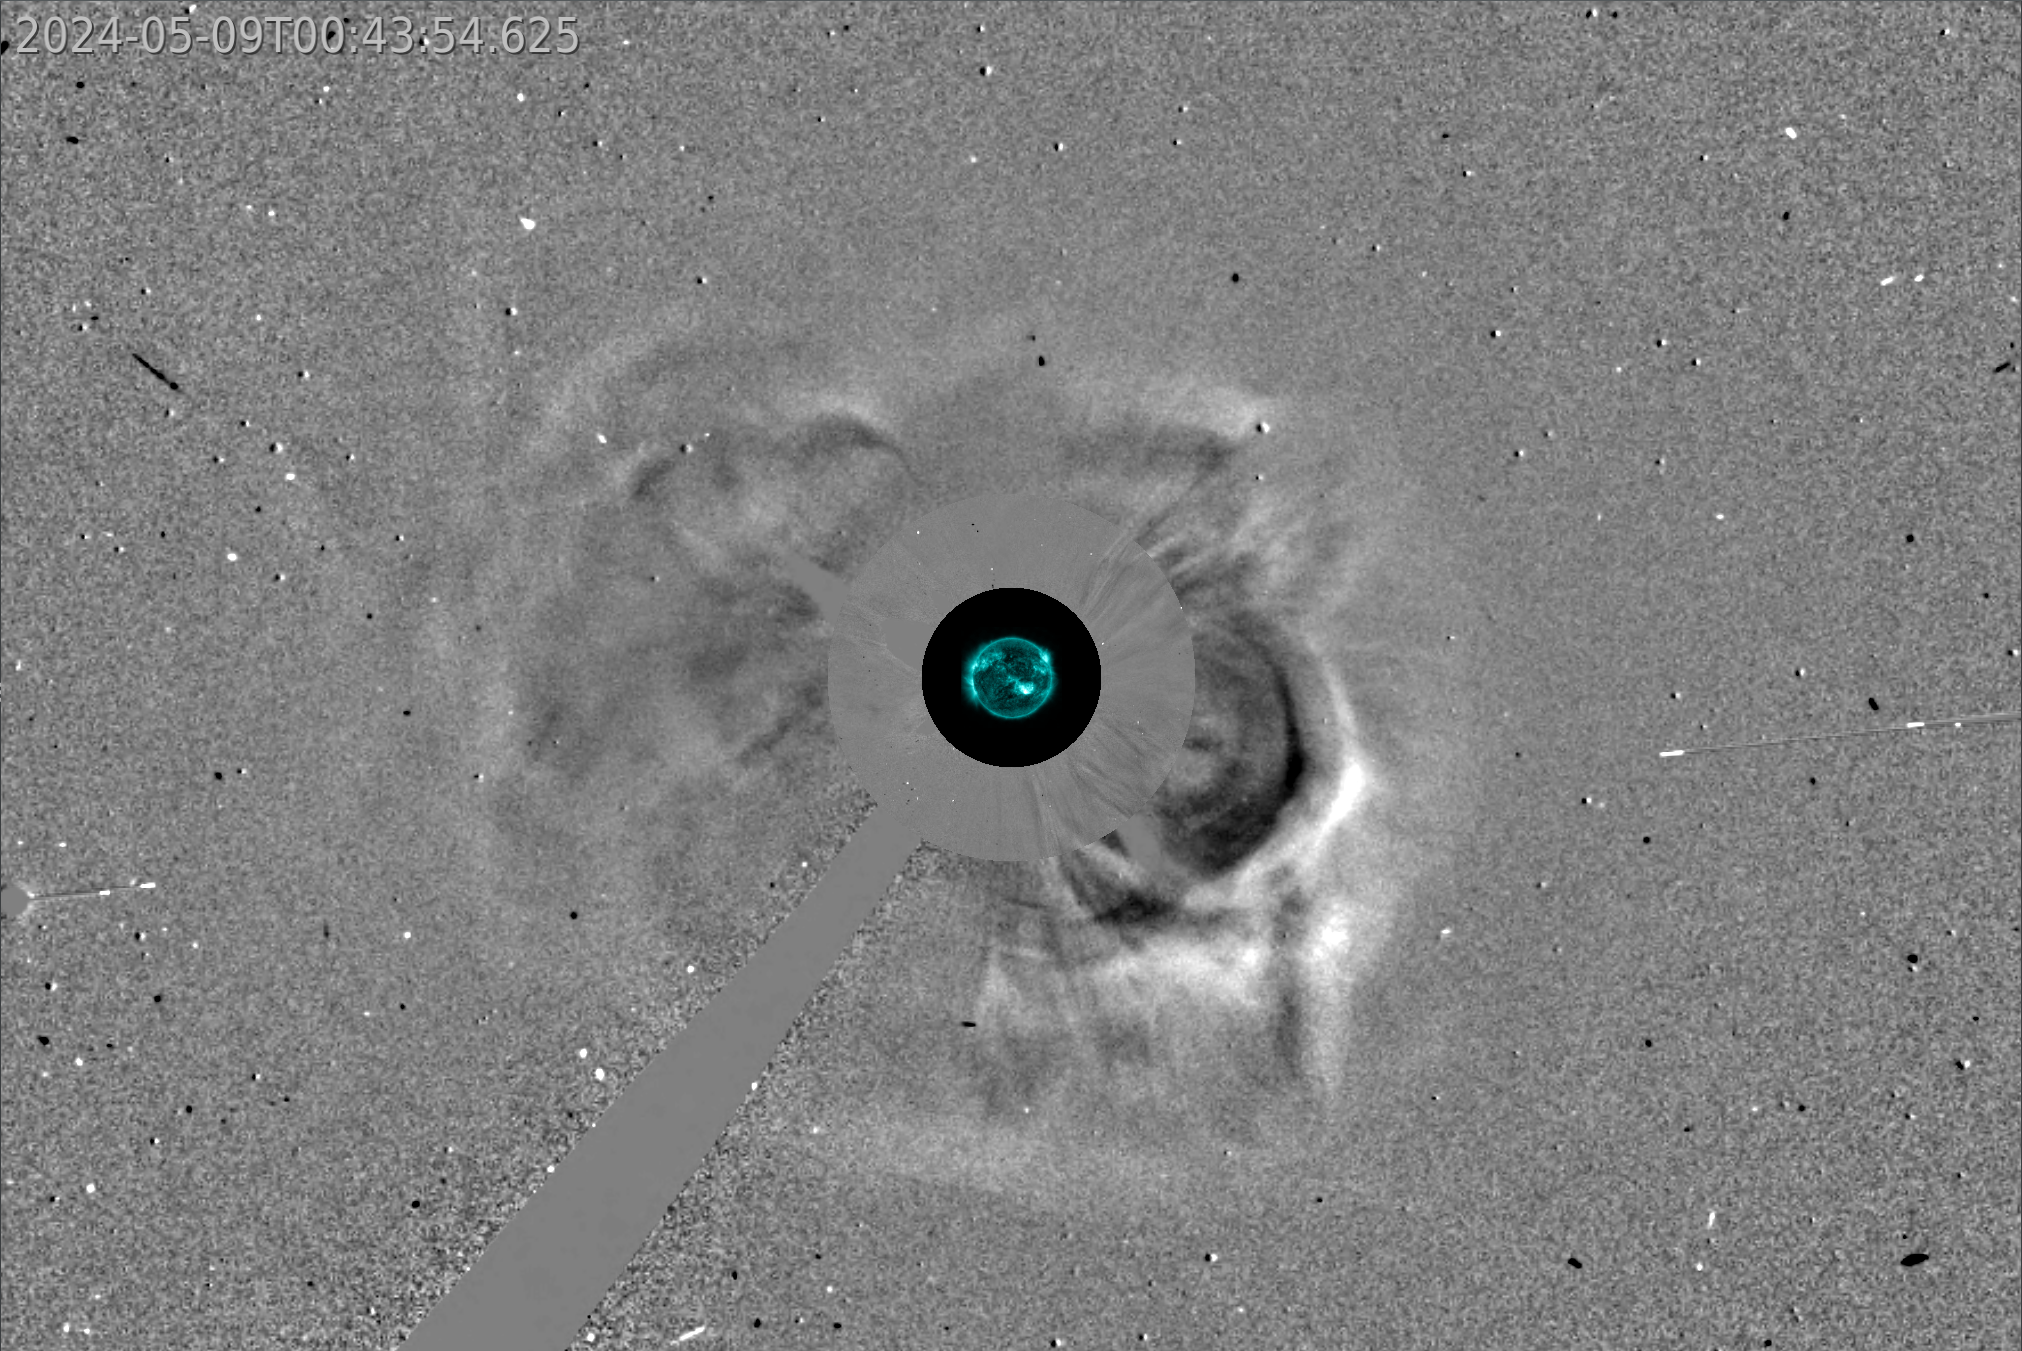
Figure 4: The third eruption directed towards the ground and associated with the X1.0 flare of 8 May peaking at 9.40pm UT. The image is a composition obtained with JHelioviewer of SOHO/LASCO C2 and C3 running difference images and SDO/AIA 171 images.
Starting from the speeds estimated in a semi-automatic way, different models have provided different estimates of the times of arrival on Earth, in particular the WSA-ENLIL model predicted that the 3 eruptions would arrive respectively at the times 2024-05-10T12:14, 2024- 05-11T01:39, and 2024-05-10T23:46, with propagation times of 41.5 hours, 57.3 hours, and 28.2 hours, respectively. In particular, the third and last eruption was therefore found to have a much greater speed than the previous two, a phenomenon which can lead during interplanetary propagation to the occurrence of the so-called “CME cannibalism” process. In cases like this, the subsequent faster eruption catches up with the slower previous eruptions during its propagation, leading to a significant amplification of possible geomagnetic effects on Earth. This phenomenon, as predicted by the WSA-ENLIL model, is shown in Fig. 5 which highlights the merging between the eruptions before their arrival on Earth scheduled for the night between 10 and 11 May 2024.
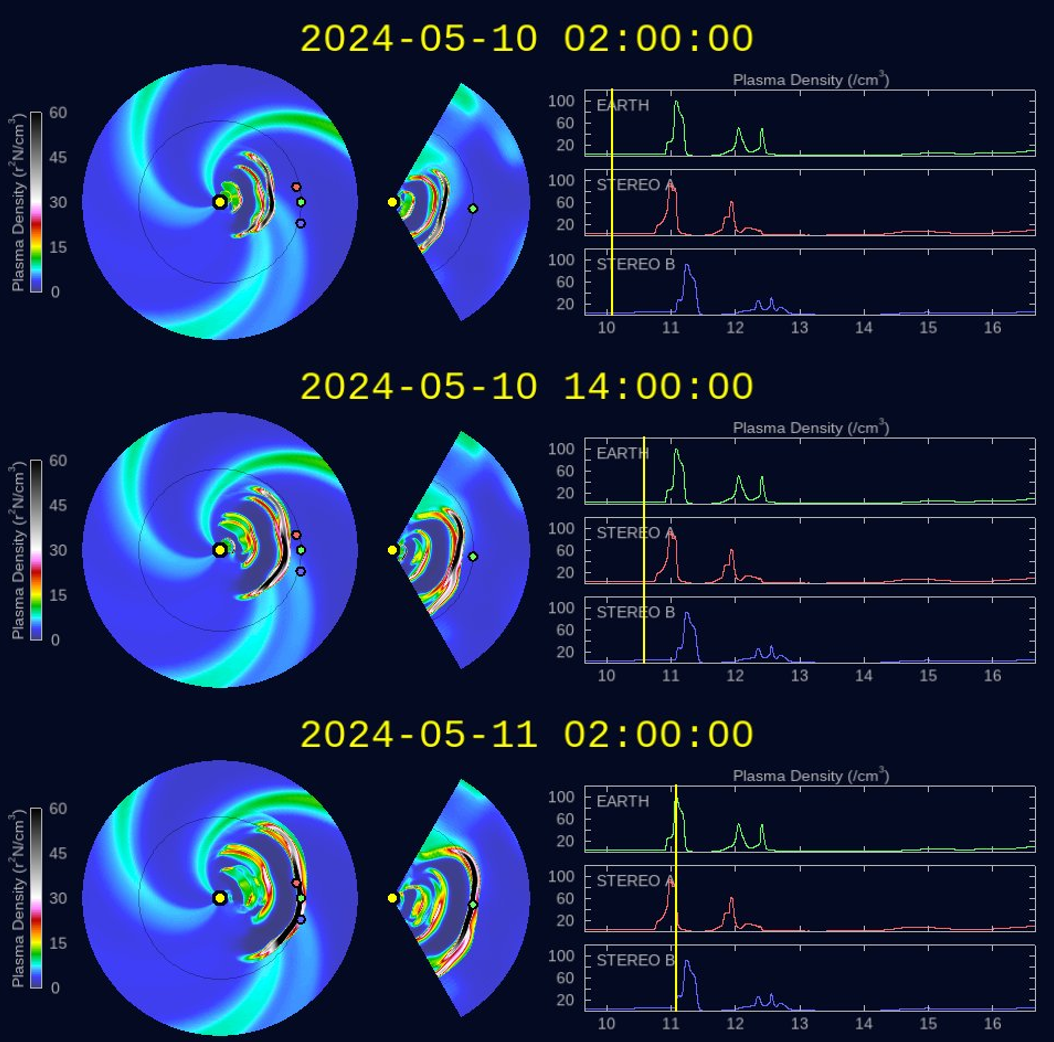
Figure 5: The sequence of forecasts provided by the WSA-ENLIL model which show the initial propagation of multiple eruptions (top panel), which then merge (central panel) and then arrive on Earth on the night between 10 and 11 May (bottom panel).
Finally, the arrival of the eruption on Earth was actually identified in the data acquired by satellites located at the Lagrangian point L1 (located approximately 1.5 million km from Earth along the Earth-Sun link). In particular, the ACE data showed the arrival between 16:30 and 16:45 UT on May 10 of a plasma shock wave with important negative Bz components of the interplanetary magnetic field. These components are among the main causes of the subsequent “opening” of the outermost layers of the Earth’s magnetosphere due to magnetic reconnection.
The geomagnetic effects were felt immediately on Earth, as shown by the evolution of the Dst index (Fig. 6). In fact, the measurements show already at 5-6pm UT on May 10th the presence of a brief peak in the Dst index, called “sudden impulse”, a clear identifier of the beginning of the geomagnetic storm. In the following hours, the value of the Dst index subsequently collapsed (the so-called “main phase” of the geomagnetic storm, connected with the intensification of the ring currents located in the innermost part of our magnetosphere), until reaching a minimum value of Dstmin = -412 nT at 03 UT on May 11th. The Dst index then began to progressively rise in the following hours (“recovery phase”, corresponding to the subsequent dissipation of the ring currents). The observed trend is very similar to that reported during other very intense geomagnetic storms (such as the famous “Bastille-day event” of 14-16 July 2000).
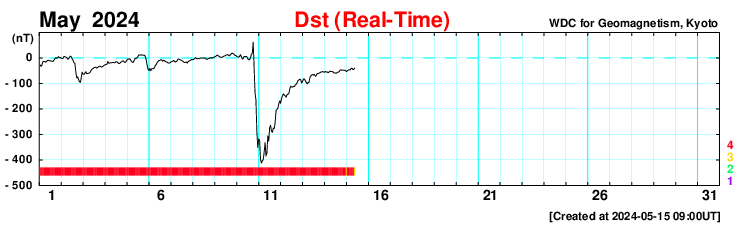
Figure 6: Evolution of the Dst index as reported by WDC for Geomagnetism, Kyoto for May 2024.
It is precisely in these hours that the observation of auroral-type emissions was reported on Earth even at rather low latitudes. Given the expected arrival time of the eruptions, the NOAA’s OVATION model (Fig. 7) envisaged the possibility of observing auroral emission over much of Europe, down to latitudes corresponding to Northern Italy. In fact, in the end significant auroral emissions were reported by many spectators who observed emissions of different colors with a predominance of emission in the red, and rather significant temporal variability with “vertical draping” shapes typical of the aurora borealis (and therefore the precipitation of energetic particles along the lines of the magnetospheric field), but which can also be associated with the phenomenon called SAR (Stable Auroral Red arch) and linked to the heating of the upper atmosphere connected with the intensification of ring currents. An example of an auroral emission observation is shown in Fig. 8 as observed by the author of this article.
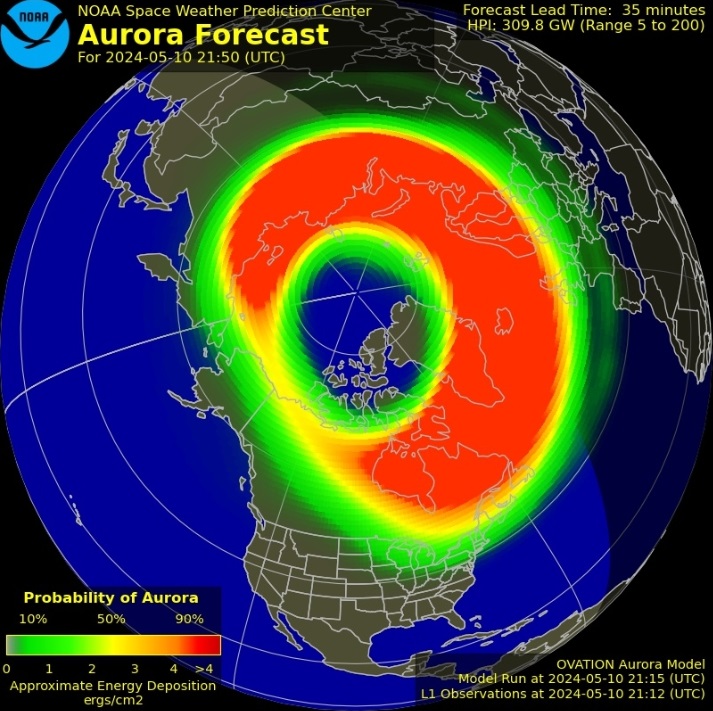
Figure 7: Prediction of the auroral oval for 21:50 UT on May 10, 2024 according to the NOAA OVATION model.
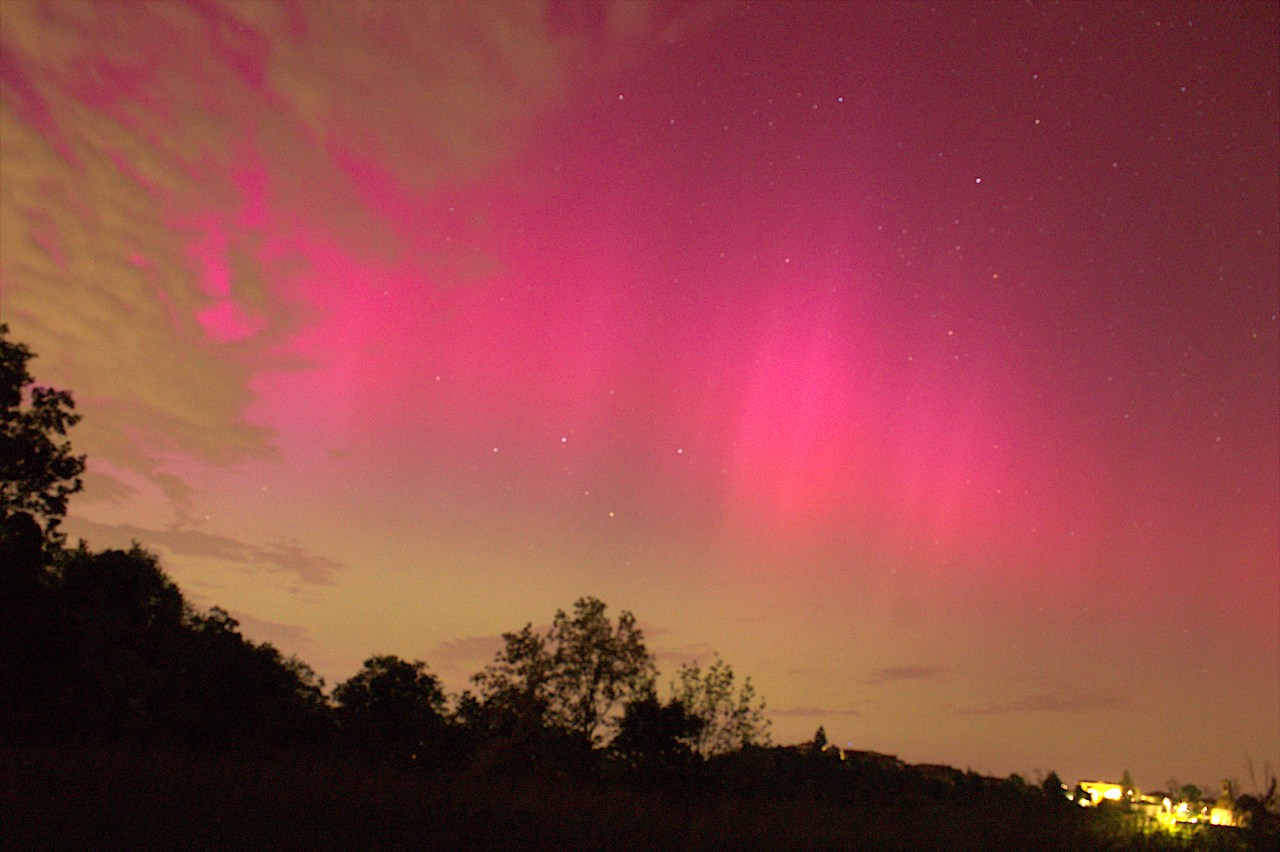
Figure 8: A shot acquired by the author with an exposure time of 30 seconds at approximately 00:12 on 10 May 2024 (local time) from the hills of the province of Turin.
This article therefore reminds us once again how the continuous monitoring of solar activity is fundamental, especially given the possible technological risk linked to events of this type which can produce significant consequences on Earth in just 4-5 days from the observation of the emergence of a new group of sunspots on the visible hemisphere of the sun.